GeoChart SVG image
Google ChartsのGeoChartで作成した地図をSVGファイル化してみます。
https://developers.google.com/chart/interactive/docs/gallery/geochart
環境
- Google Chrome
- Hexo
- hexo-tag-googlecharts
- Visual Studio Code
- Marp for VS Code
手順
-
HexoでGoogle Chartsの地図を作成
私はHexoでhexo-tag-googlechartsタグプラグインを使っています。
https://ktkr3d.github.io/2019/06/26/Hexo-Tag-Google-Charts
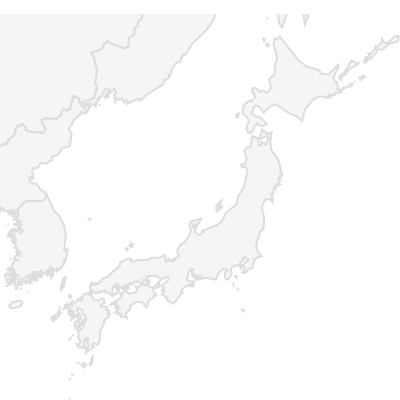
日本地図の最低限の記載は以下。{% googlecharts GeoChart 0 0 %}
-
{"region": "JP"}
''
{% endgooglecharts %}
この状態でマウスホバーに反応します
GeoChart 0 0→余白調整なしのオリジナルのサイズGeoChart→デフォルトサイズ(400 x 400)GeoChart 400 250→サイズ変更(400 x 250)
-
ブラウザで表示してF12でデベロッパーツールを起動
-
選択ツールで地図をクリック
-
上位階層の
<svg>タグを右クリックして、Copy > Copy elementを選択 -
エディタに貼り付け、ファイル拡張子を.svgにして保存
最上位の<svg>タグは以下のようになっている。<svg width="539" height="336" aria-label="A chart." style="overflow: hidden;">
-
画像として扱えるように
<svg>タグにxmlns属性を追加xmlns="http://www.w3.org/2000/svg"
VSCode上で画像表示とテキスト表示を切り替えるには、右上のドロップダウンリストボックスでモードを切り替えます。
-
位置の移動、拡大する場合は以下のviewBox属性を追加
viewBox="90 70 200 200"
横移動、縦移動、幅、高さ
-
凡例(legend)の数値を消す場合
終了タグ</text>の直前の数値を削除
GeoChartのデータ項目仕様
regions モード(地域の色分け)
国や都道府県などのエリア全体を塗りつぶしてヒートマップを表示するモード
-
データ項目
列 要否 型 説明 1 必須 文字列 地域名または地域コード 2 数値 色付け(濃淡)を決める数値 3 文字列 ツールチップテキスト
markers モード(マーカーの配置)
特定の都市や地点に円などのマーカー(ピン)を配置するモード
-
緯度・経度(座標)で正確に指定する場合
列 要否 型 説明 1 必須 数値 緯度 2 必須 数値 軽度 3 数値 マーカーの「色」を決める数値 4 数値 マーカーの「大きさ」を決める数値 5 文字列 ツールチップテキスト -
都市名や住所で指定する場合
列 要否 型 説明 1 必須 文字列 都市名や地域 2 数値 マーカーの「色」を決める数値 3 数値 マーカーの「大きさ」を決める数値 4 文字列 ツールチップテキスト 都市名から緯度、経度への変換のためにmapsApiKeyの設定が必要らしい
text モード(テキストラベルの表示)
地図上の指定した位置にテキストラベルを直接重ねて表示するモード
-
緯度・経度(座標)で正確に指定する場合
列 要否 型 説明 1 必須 数値 緯度 2 必須 数値 軽度 3 数値 テキストラベルの「色」を決める数値 4 数値 テキストラベルの「大きさ」を決める数値 5 文字列 ツールチップテキスト -
都市名や住所で指定する場合
列 要否 型 説明 1 必須 文字列 都市名や地域 2 数値 テキストラベルの「色」を決める数値 3 数値 テキストラベルの「大きさ」を決める数値 4 文字列 ツールチップテキスト 都市名から緯度、経度への変換のためにmapsApiKeyの設定が必要らしい
利用
-
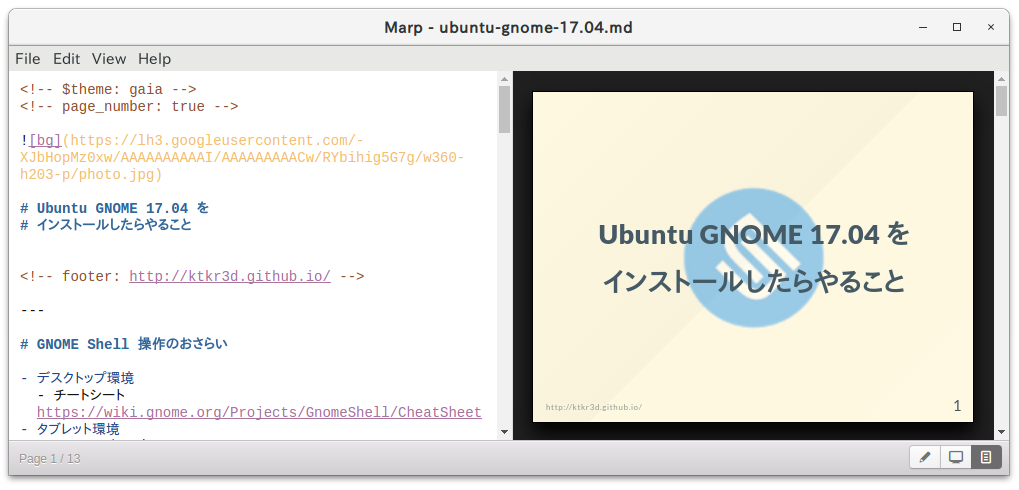
スライドに貼り付けてみました
ソースコードは sample-presentation2.md
該当箇所はスライド9 -
Marp関連の過去記事
https://ktkr3d.github.io/2017/04/14/Marp
https://ktkr3d.github.io/2020/05/27/Marp-for-VS-Code
その他のサンプル
カスタマイズ例
-
regions モード(地域の色分け)
{% googlecharts GeoChart 0 0 %}
-
{"region": "JP", "displayMode": "regions", "backgroundColor": "aliceblue", "resolution": "provinces", "colorAxis": {"colors": ["white", "green"]}, "legend": "none"}
'都道府県', '訪問回数'
'北海道',   5
'東京',   10
'愛知',   5
'大阪',   5
'福岡',   0
{% endgooglecharts %}
オプション 値 説明 “region” “JP” 表示する地域を日本に限定 “displayMode” “regions” 地図の表示モードを「地域(面)の塗りつぶし」 “backgroundColor” “aliceblue” 地図の背景色(主に海の部分)を薄い水色 “resolution” “provinces” 地図の解像度(区切り)を都道府県(州・省)単位 “colorAxis” {“colors”: [“white”, “green”]} データの数値に応じたカラーグラデーションの範囲 “legend” “none” 凡例(カラーバーのレジェンド)を非表示 -
markers モード(マーカーの配置)
{% googlecharts GeoChart 0 0 %}
-
{"region": "JP", "displayMode": "markers"}
'Latitude', 'Longitude', 'Value', 'Size', {type: 'string', role: 'tooltip'}
35.6895, 139.6917, 100, 500, '東京\nValue: 100\nSize: 500'
34.6937, 135.5022, 60,  300, '大阪\nValue: 60\nSize: 300'
43.0621, 141.3544, 20,  150, '札幌\nValue: 20\nSize: 150'
33.5904, 130.4017, 40,  200, '福岡\nValue: 40\nSize: 200'
{% endgooglecharts %}
公式サンプル
https://developers.google.com/chart/interactive/docs/gallery/geochart?hl=ja
-
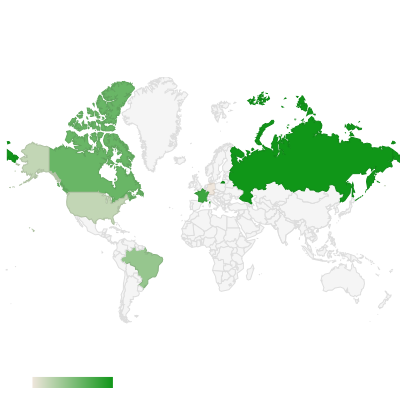
地域の GeoChart
{% googlecharts GeoChart 0 0 %}
-
{}
'Country', 'Popularity'
'Germany', 200
'United States', 300
'Brazil', 400
'Canada', 500
'France', 600
'RU', 700
{% endgooglecharts %} -
マーカー GeoChart
{% googlecharts GeoChart 0 0 %}
-
{"region": "IT", "displayMode": "markers", "colorAxis": {"colors": ["green", "blue"]}}
'City',   'Population', 'Area'
'Rome',      2761477,    1285.31
'Milan',     1324110,    181.76
'Naples',    959574,     117.27
'Turin',     907563,     130.17
'Palermo',   655875,     158.9
'Genoa',     607906,     243.60
'Bologna',   380181,     140.7
'Florence',  371282,     102.41
'Fiumicino', 67370,      213.44
'Anzio',     52192,      43.43
'Ciampino',  38262,      11
{% endgooglecharts %}
都市名から緯度、経度への変換のためにmapsApiKeyの設定が必要らしい