
Slidev - Google Charts
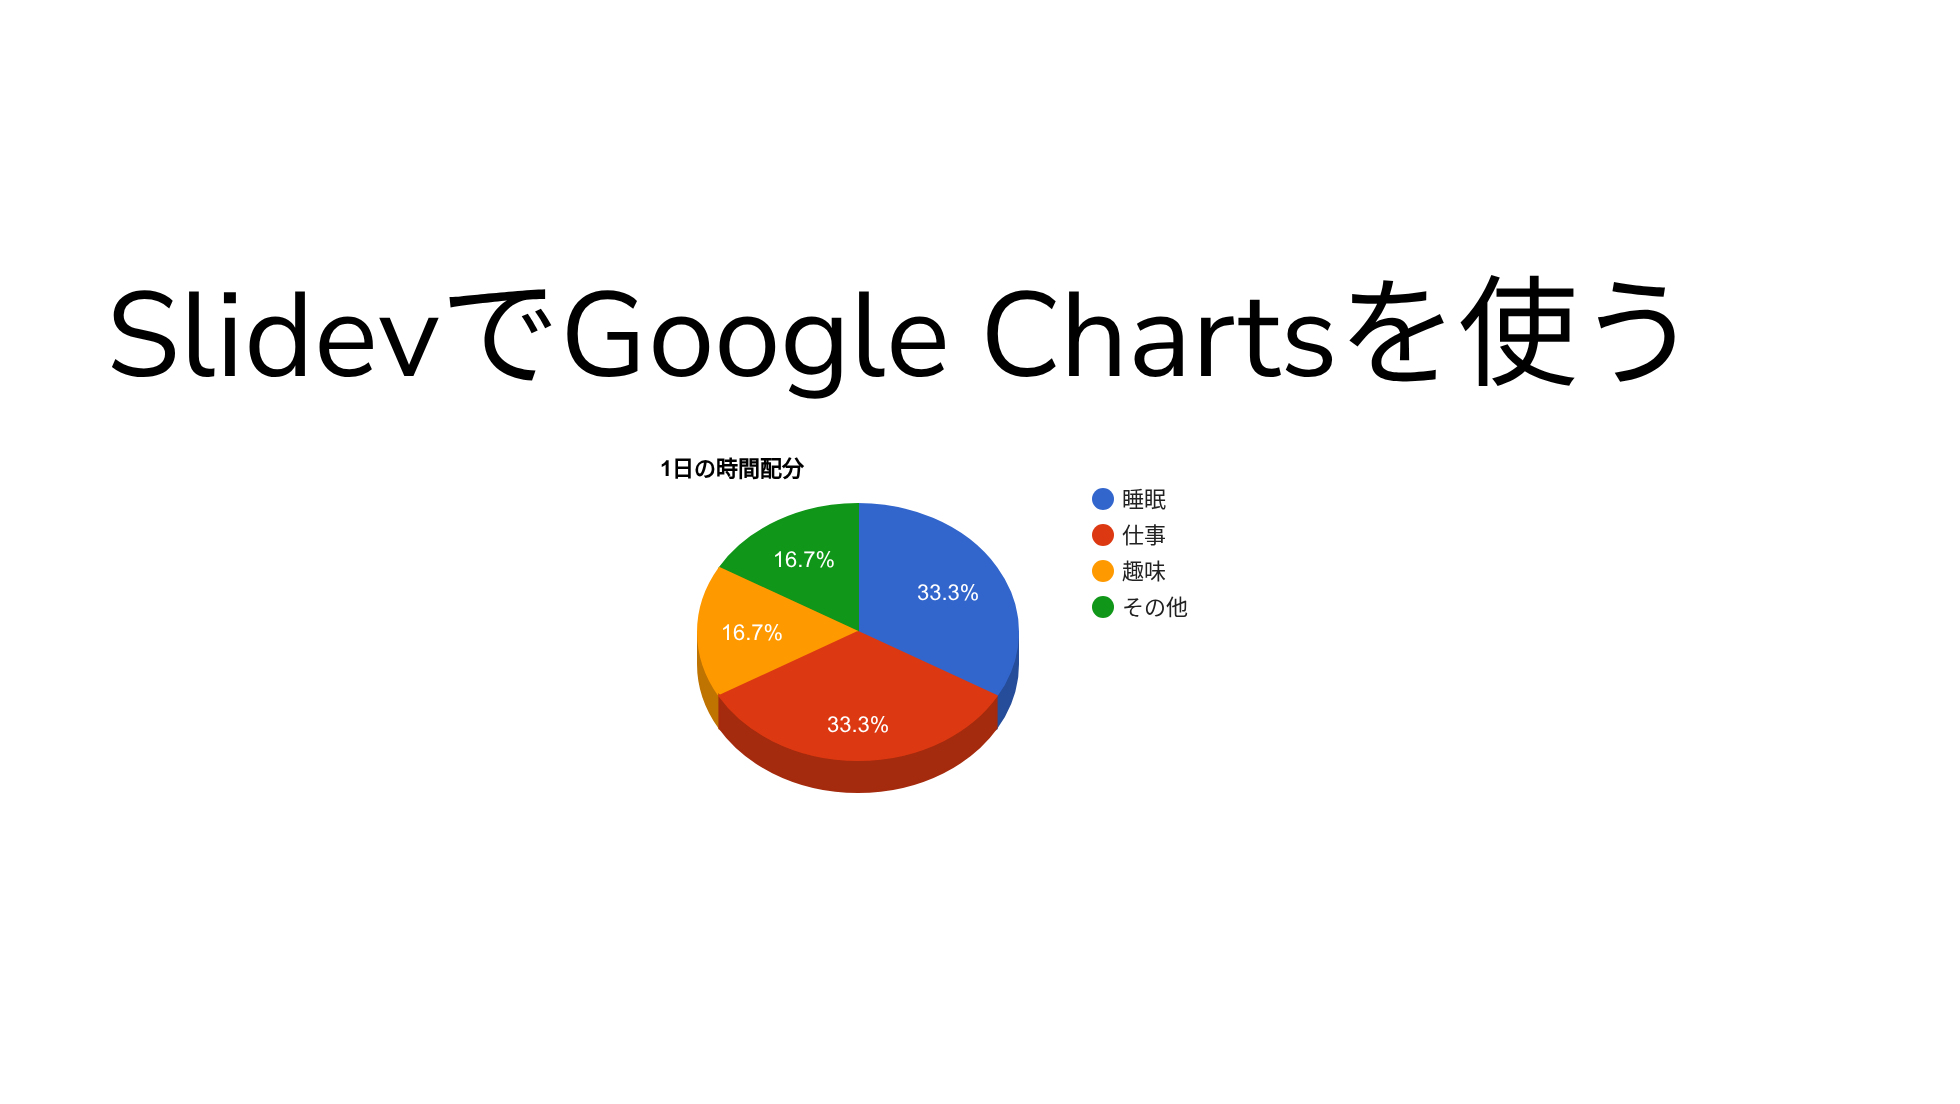
SlidevでGoogl Chartsのグラフをスライドにしてみました。
https://sli.dev/
https://developers.google.com/chart
環境
- arch linux
- nodejs
- playwright
構築
プロジェクト作成
npx init slidev |
デフォルトのスライドが表示される。Qで終了する。
コンポーネントの作成
cd slidev |
<!-- components/GoogleCharts.vue --> |
利用
スライドの作成
--- |
npx slidev slides_googlecharts.md |
Oで開く。Qで終了する。
PDFエクスポート
npx playwright install |
後で整理
npx slidev export slides_googlecharts.md |
PNGエクスポート
npx slidev export slides_googlecharts.md --formart png |
ls slides_googlecharts-export/ |
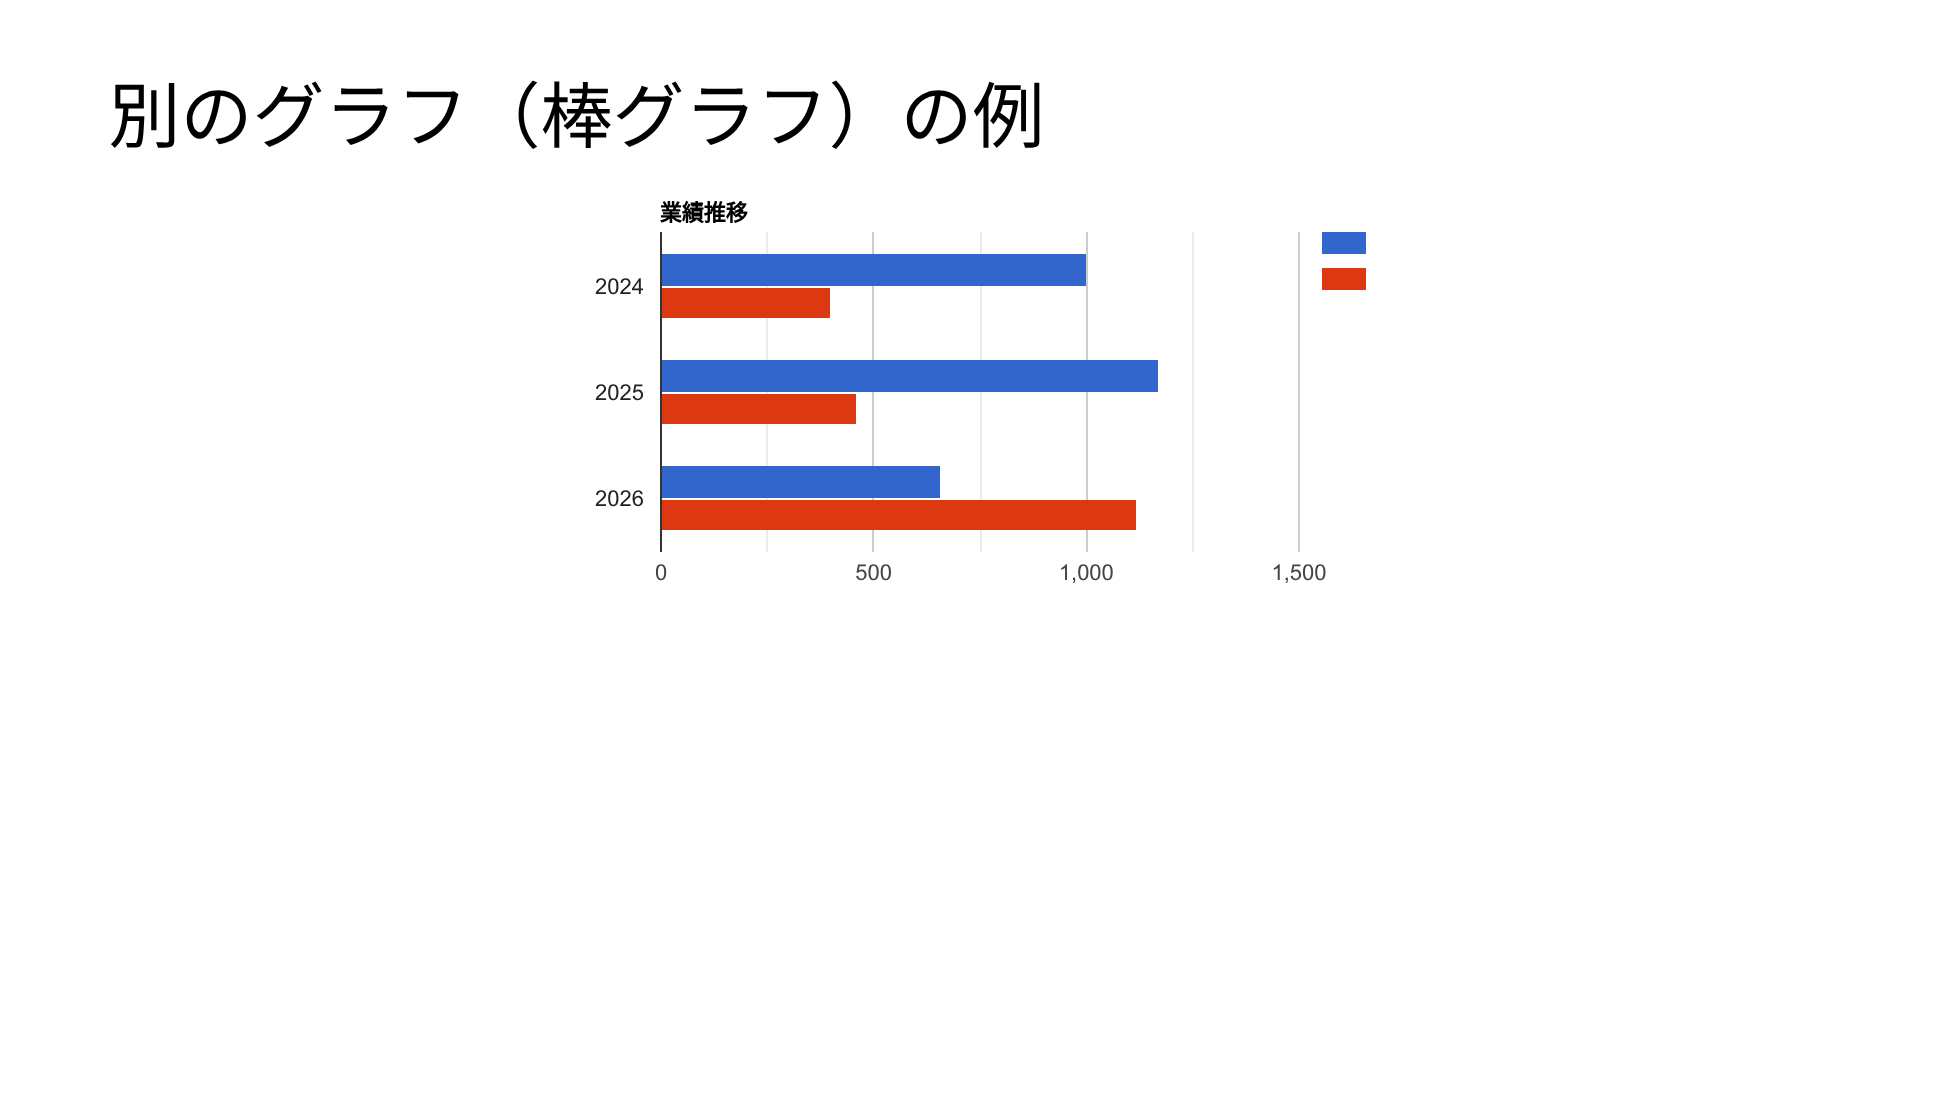
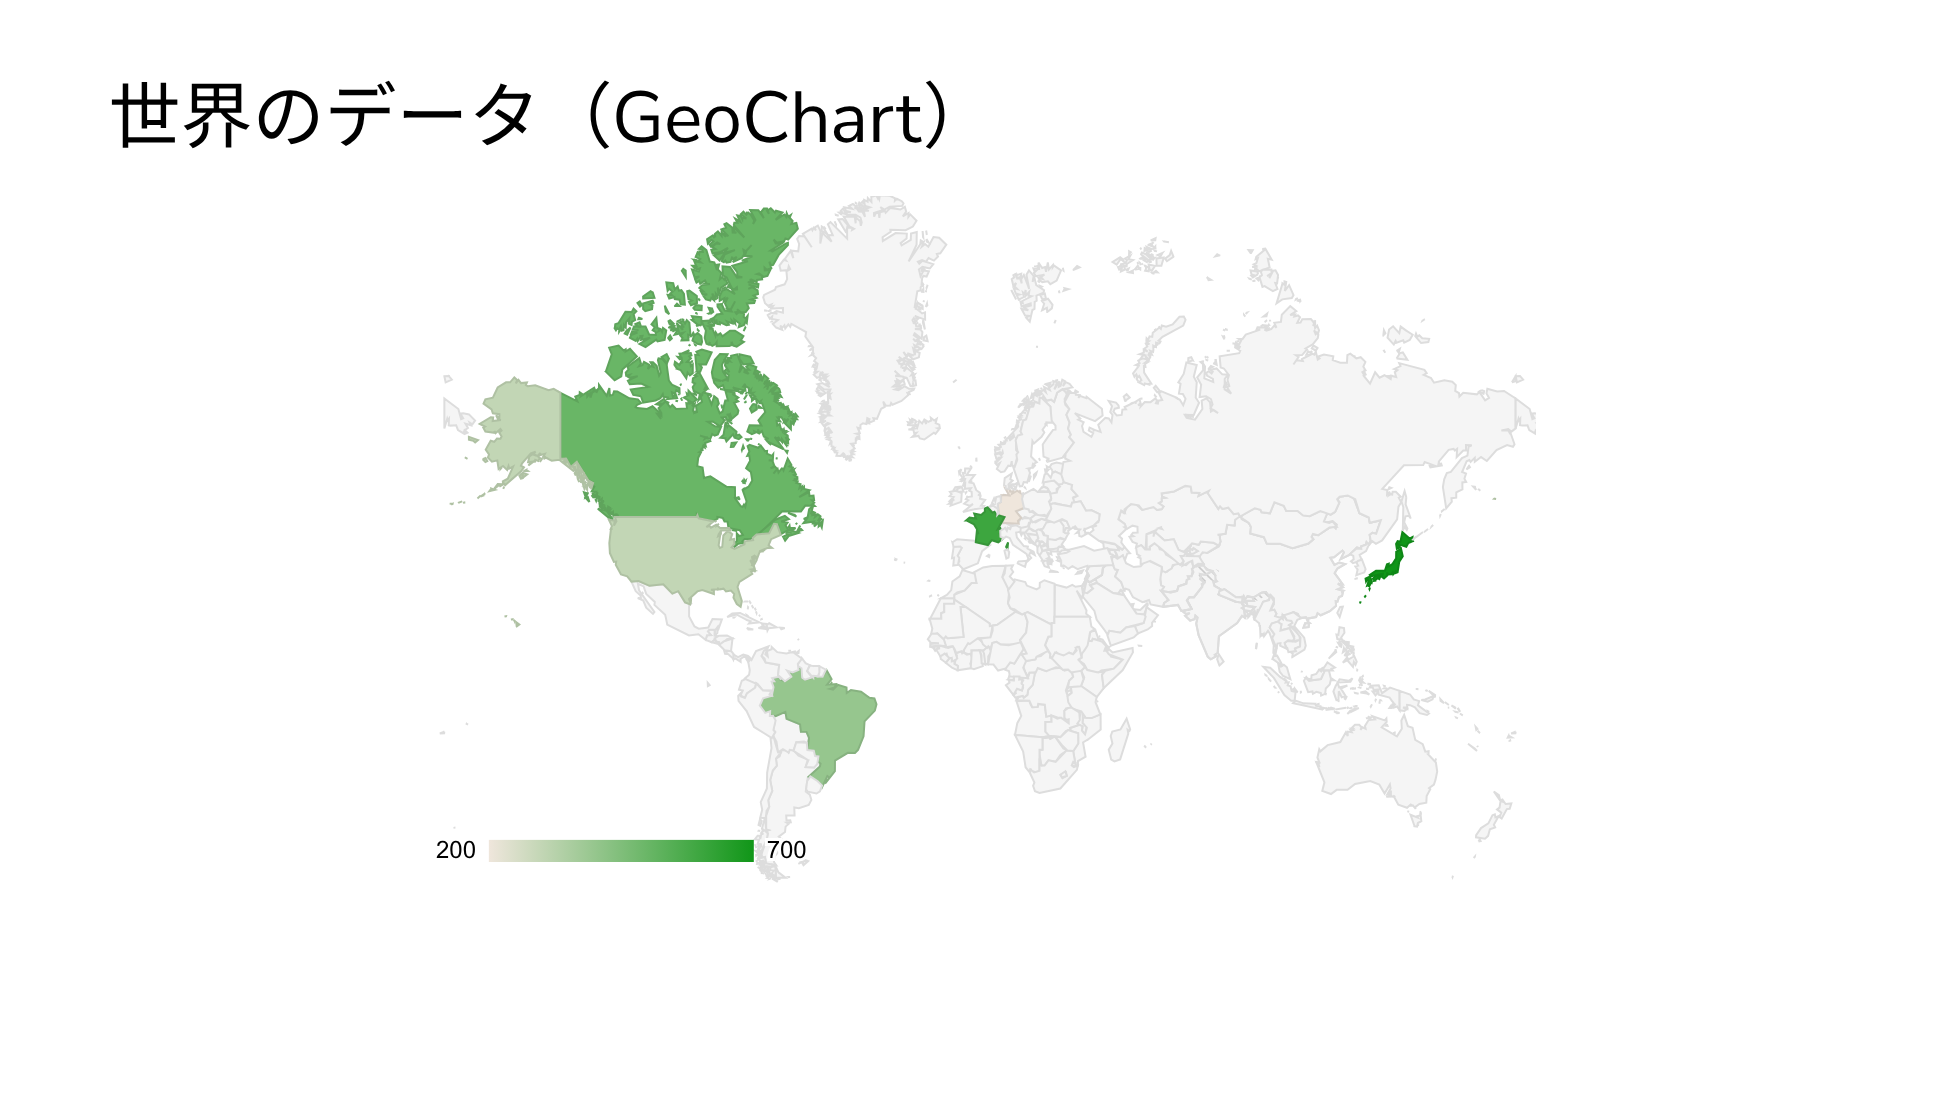
アドオン化
アドオン側
{ |
利用
- slidev環境
npm install @slidev/cli |
npm install ktkr3d/slidev-addon-google-charts |
- テンプレ―ド化
---
theme: default
title: My Presentation
addons:
  - slidev-addon-googlecharts
---

# 1ページ目
ここからスライドを開始します。
---

---

---
Related Articles

2021-12-19
Slidev
https://sli.dev/https://github.com/slidevjs/slidevSlidev でスライドを作成してみました。 環境 Windows 10 Pro node v14.60.0 感想 NTFS 上にプロジェクトを配置するのであれば、Windows のnode を利用するのがよいかもしれない。WSL のnode ではファイルの更新がうまく検知されないみたい。 npm init slidev でプロジェクトを作成するとnode_modules フォルダで260MB消費された。プロジェクトは一つだけにした方がよさそう。 生成されたslides.md は使用せず、このフォルダ下にスライド群(.md)を作っていくのがよいかもしれない。 PDF にエクスポートするにはnpm i -D playwright-chromiumしておく。npx slidev export slidev-test.mdすると、slidev-test-export.pdfが生成される。 ローカル画像はpublicフォルダ下に配置する。/hoge.pngで参照する。 マークダウン...
2026-09-05
slidev-addon-google-charts
Slidev用のGoogle Charts用アドオンを作成してみました。 https://github.com/ktkr3d/slidev-addon-google-charts https://sli.dev/ https://developers.google.com/chart アドオンのテストをしながら、オリジナルのスライドテーマを作るのが楽しい。 レイアウト例のスライド https://github.com/ktkr3d/slidev-addon-google-charts/tree/main/playground レイアウト例 (+スライドテンプレート) 環境 Windows npm 12.0.2 @slidev/cli 52.19.1 Arch Linux npm 12.0.2 @slidev/cli 52.19.1 利用共通作業 プロジェクトフォルダを作成 mkdir slidev-workspacecd slidev-workspace Slidevを初期化 npm init -y...
Comments